
Start with the virtual replica of your venue. Scale into sales
Accurate visualizations power better discovery, simpler decisions, and higher sales conversion.
Venue Mapping
Create and distribute four types of digital assets, depending on client and customer needs. All assets can be integrated into third-party digital channels via 3DDV’s proprietary DVM (Digital Venue Maps) API.
Products Available
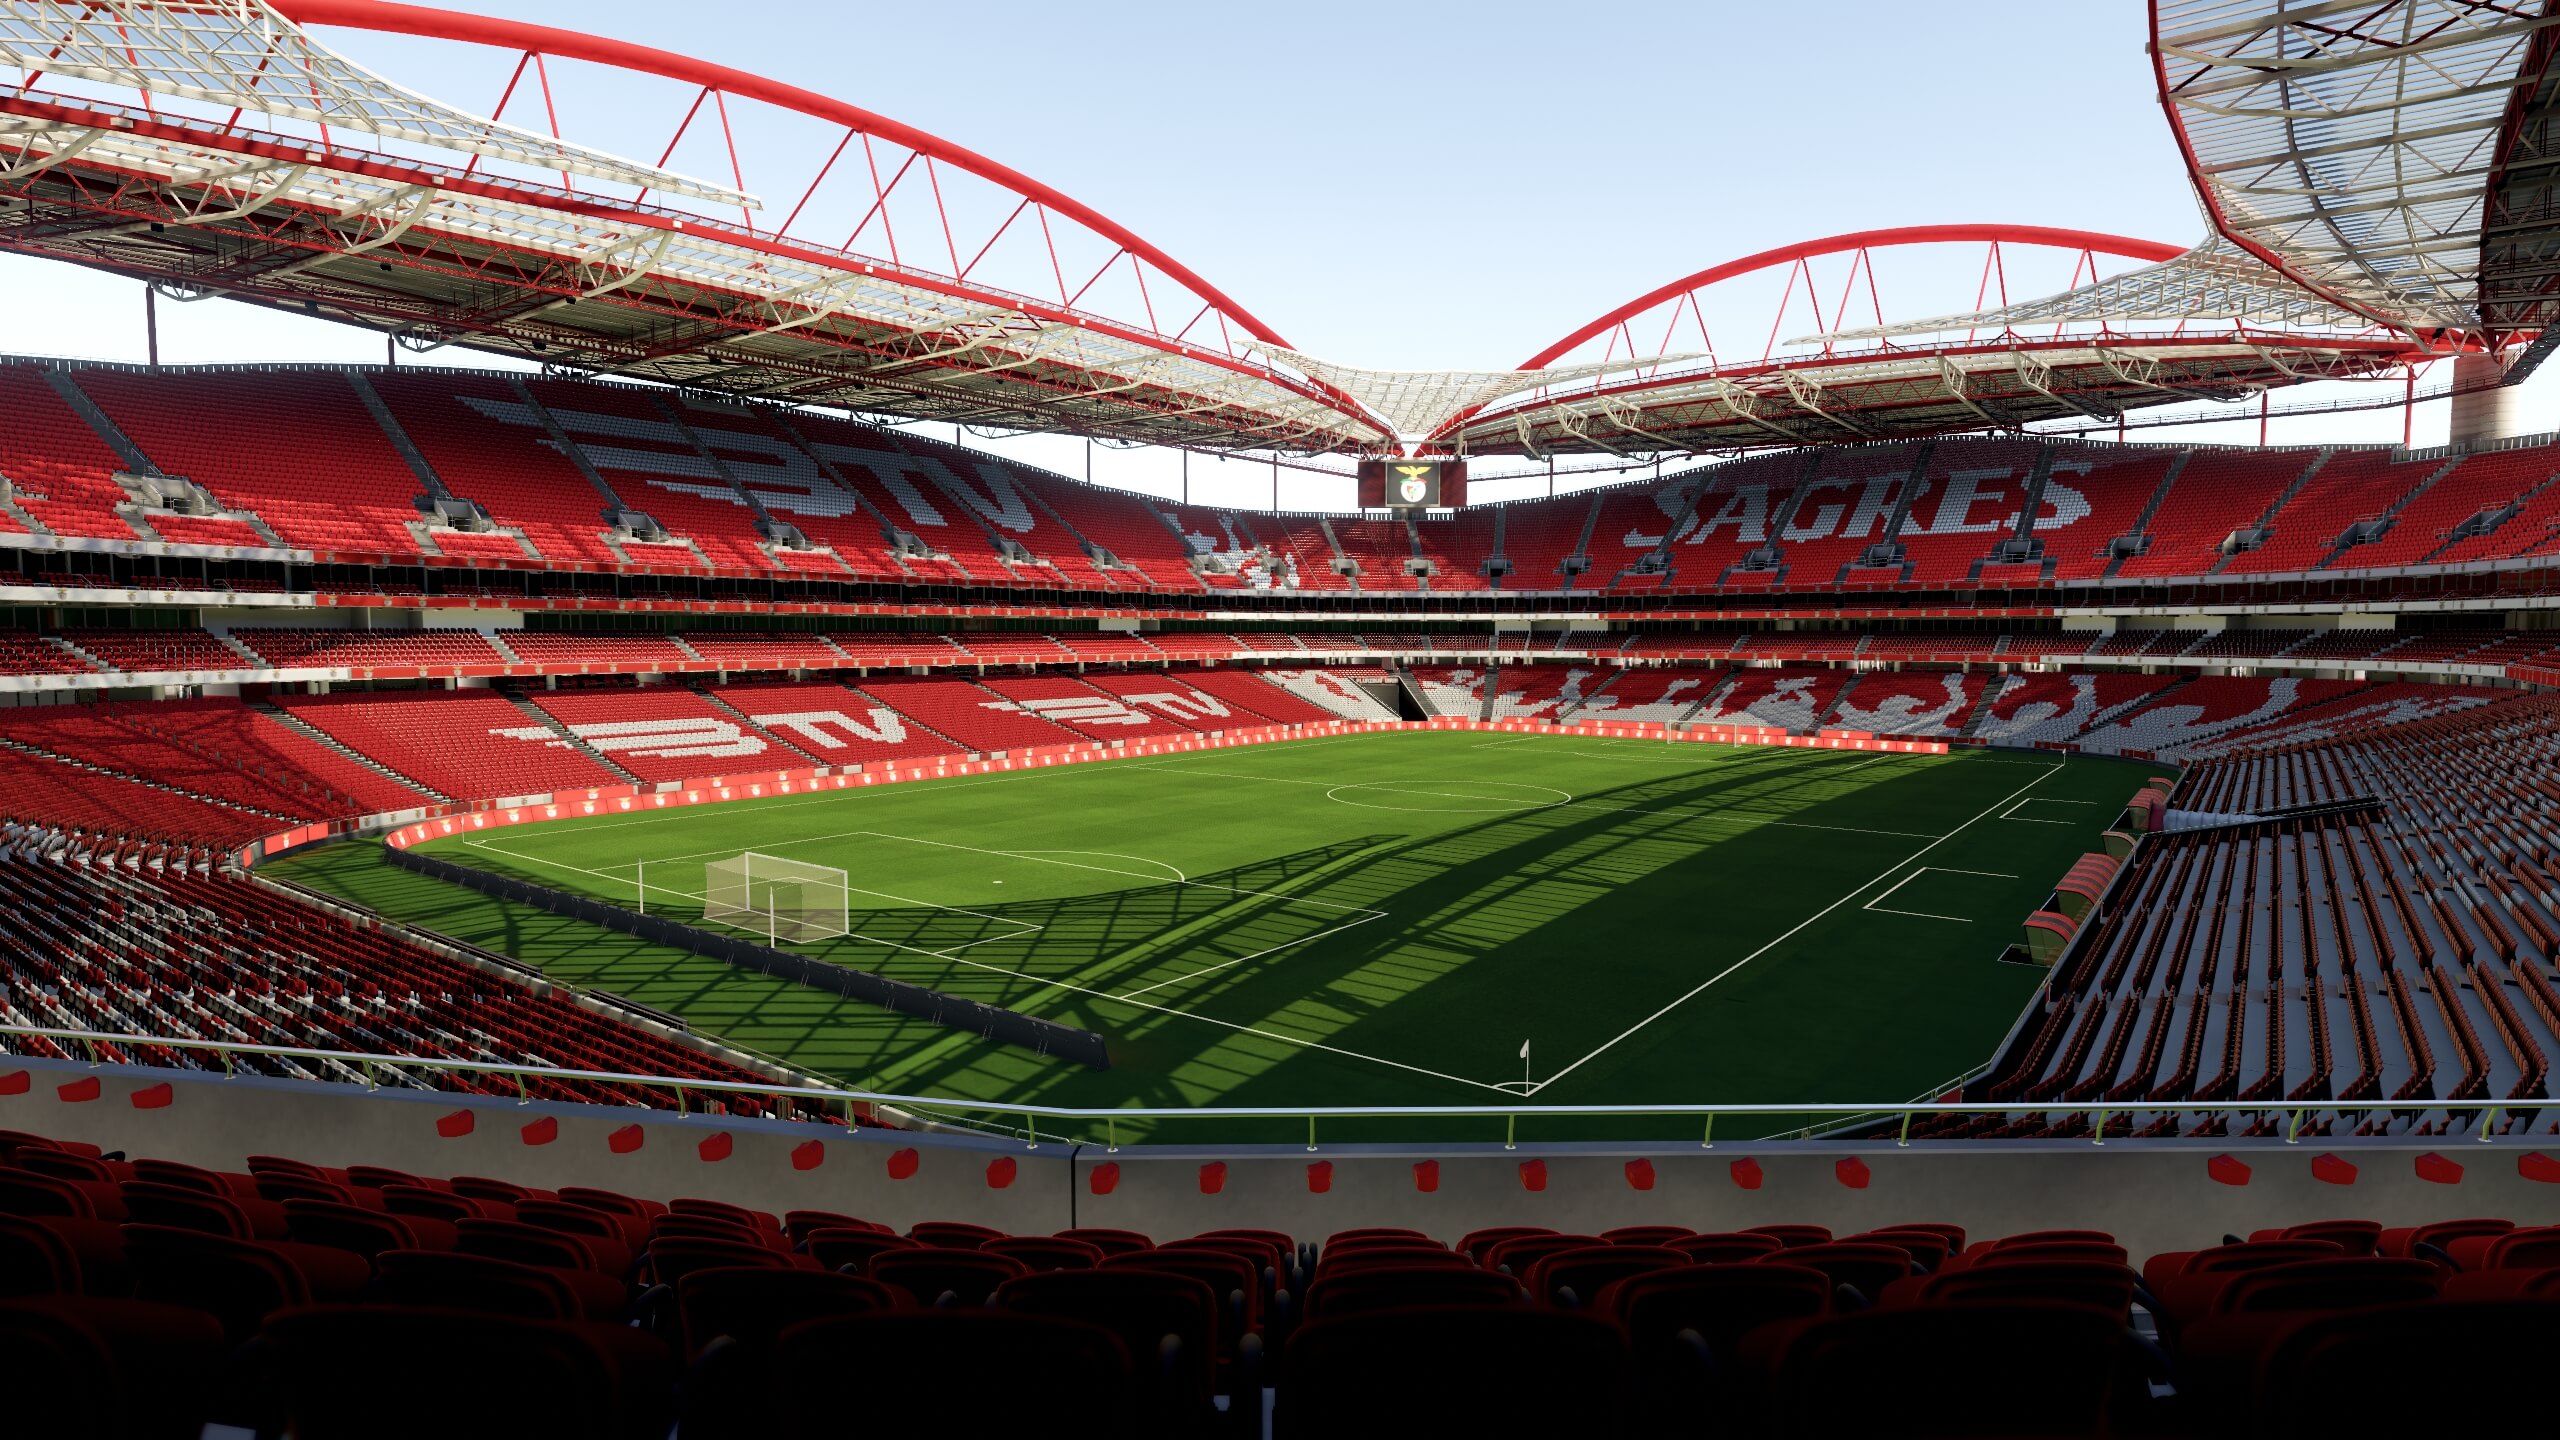
2D Mapping / 3D Mapping
/ 3D Seat View Visualization / VIP Hospitality Visualization
Web Sales Portals
Adopt and integrate ready-to-use online sales infrastructure that enables customization and boosts sales.
Products Available
Premium Sales Portal / Seat Management Portal / Group Sales Portal / In-Game Seat Upgrade / Seating Data Viewer
How 3DDV’s Proprietary Technology Platform Works
Virtualize
Build true-to-scale digital twins of new or existing venues.
Stadiums
Arenas
theaters
racetracks
New & Existing venues
Integrate
Deliver ticketing, maps, season packages, and seat-level views to your web and mobile channels via API.
Seat Maps
Season Tickets Integration
Interactive Maps
Single Seat 360º Views
Monetize
Embed analytics and management tools that support your commercial strategy (ticket pricing, premium packages, group strategies, and more).
Brand Activation
VIP & Hospitality
Experiences
Sales Material
Best-in-Class Clients & Partners


Results at a glance
+650
3D Venues Created
+5600
Venue Twins and Seating Charts
+1 Billion
Seat Views Delivered
20
Countries with 3DDV Solutions